Stage1
Stage 1: Promiscuous Interpolation
Inspiration:
In 1993, Field, Hayes, & Hess reported on a phenomenon they termed contour integration. They observed that, in stimuli like the one shown below, perceptual “pop-out” of a path is achieved when the elements in that path are constrained such that their relative positions and orientations meet certain geometric criteria. These stimuli are often called path detection stimuli because they involve the detection of a target path against a random background.

At left, a “target”, composed of 8 elements whose positions and orientations are organized to define a path, is shown. At right, that same “target” is hidden within a background consisting of elements with random orientations and positions. In this particular stimulus, the positions & orientations of the elements within the target are held to certain geometric constraints. As a result, observers will likely readily detect the target in the image at right. As the element positions and orientations are instead allowed to violate these certain constraints, the detectability of the target is reduced.
What causes the elements in the target to “pop-out” from the background?
The target is readily detectable so long as it is true, for each gap between successive elements, that a path could be drawn connecting the first element to the next, and that the path could be:
1) monotonic
2) and bend through fewer than 90 degrees
So long as these constraints are met, the visual system appears to integrate the elements within a path into a single perceptual unit or object, causing them to “pop-out” from a background of randomly oriented elements. This phenomenon, therefore, has the potential to reveal what characteristics of edge fragments the visual system utilizes to determine whether two fragments belong to the same object.
What is the relationship between contour integration and contour interpolation?
Having read the introduction to contour interpolation on the previous page, you may have noticed that the constraints dictating the “pop-out” of target paths look remarkably similar to the relatability constraints that dictate whether the visual system will draw an interpolated connection between two edge fragments. They both share a monotonicity constraint and a 90 degree constraint. It therefore seems likely that contour integration and contour interpolation rely on the same process. What is unique about the path detection stimuli, like the one above, is that no interpolated edges are perceived to connect the path elements.
Why might the “pop-out” of target paths depend on the contour interpolation geometry when no interpolated contours are perceived to connect the path elements?
Other work has begun to suggest that the contour interpolation process may proceed in two stages:
1) In the first stage, pairs of edges that meet the relatability geometry constraints are identified, and contours are interpolated indiscriminately across all such pairs of relatable edge fragments (promiscuous interpolation).
2) However, not all of these interpolations will, ultimately, appear in our final perception of the scene. In the second stage, the visual system takes into account multiple other kinds of information in order to determine which interpolations are good ones and which interpolations are bad ones. Some interpolations will be deleted, while others will be strengthened or maintained.
It therefore seems possible that the “contour integration” observed by Field, Hayes, and Hess (1993) is revealing the first, earliest stage of the contour interpolation process. Because the elements in the target meet the relatability geometry constraints, interpolated connections between each pair of successive edge fragments should be created in the first stage. At the second stage, however, other information is taken into account to determine whether the interpolated edges will, ultimately, appear in our perception. It may be the case that some information conveyed by another cue in the scene is causing the interpolations in the path detection stimuli to be deleted.
What cue in the path detection stimuli might be causing the deletion of interpolated edges?
The “Oreo” cookie-shaped elements used in the stimulus above are like those originally used by Field, Hayes, and Hess, and are a common choice among vision scientists. These “Gabor” elements, as they are called, are of particular interest to vision scientists because they share some useful properties with filters used by the visual system to extract features from images. However, the black-to-white-to-black surface colors of these elements may not be conducive to the appearance of interpolated edges in these stimuli.
There are two kinds of situations, in the real world, for which the visual system should want to produce interpolated edges. Both of these situations are cases when real edges may be missing from the visual input:
1) partial occlusion of an object (that is, some parts of an object are partially covered up - because another object or parts of the object itself are
in the way)
2) the object lacks contrast with its background
If the cues taken into account in Stage 2 indicate that neither of these two situations is true for some interpolations produced in Stage 1, then those interpolations should be deleted.
It is worth noting, therefore, that there is no occluding object in the stimulus image above. In the absence of an occluder, the interpolations can only be valid if it is the case that, along parts of its boundary, an object lacks contrast with its background. However, in the stimulus above, the visible edges are black and white - they are never grey, like the background. If the background were, instead, white, or if the interior white parts of the elements were instead grey, then interpolated contours might be perceived connecting the edge elements.
The stimulus below was uses modified elements with crisper edges and grey centers. Because it is plausible that a grey bar is partially occluding some black circles and lacks contrast with its grey background, the observer may perceive interpolated grey edges traversing the gaps between the elements.

At left, a target path, composed of 8 elements, is set against a random background. At right, the target is isolated. Because it is plausible that a grey bar is partially occluding some black circles and lacks contrast with its grey background, the observer may perceive interpolated grey edges traversing the gaps between the elements.
Theory & Hypothesis:
The perceptual “pop-out” of paths observed by Field, Hayes, & Hess (1993) is revealing the intermediate (that is, not final) output of the first stage of the contour interpolation process. In the original stimuli, the absence of an occluder and the presence of surface color differences between the edge fragments and the gaps between the fragments are taken into account in the second stage. The result is the deletion of the interpolated edges from the scene.
If the contour interpolation process underlies the “pop-out” of paths in these displays, then it should be true that other known constraints on contour interpolation are also constraints on the perceptual “pop-out” of these paths. One relatively little known (and somewhat unusual) constraint on contour interpolation is that of a retinal tolerance for misalignment of edge elements of about ~16 arc minutes. That is, edge fragments can be slightly misaligned, and interpolation can still proceed. The amount of misalignment that is tolerable is approximately 16 minutes of arc (an arc minute is 1/60th of a degree of visual angle - a measurement in terms of the angle of visual field).
This constraint is somewhat unusual because the amount of misalignment that is tolerable is based on a retinal rather than relative measurement. This means that what matters is how large the misalignment is on the retina - not how large the misalignment is relative to the sizes of the fragments. This is unusual because it, in effect, means that some fragments that appear disconnected up close will suddenly appear connected once one gets further away (this is illustrated in the figure below). Many other visual constraints avoid this dependence on retinal sizes, ensuring that the perception of an object will not change as one gets closer to or further away from it. The uniqueness of the retinal misalignment constraint on contour interpolation makes it particularly worth testing whether “pop-out” of paths depends on this same constraint.
The retinal tolerance for misalignment means that fragments that appear connected from far away may appear disconnected up close. Here, nearness to the object is mimicked by enlarging the size of the image. The distant misaligned fragments may appear connected, while they appear disconnected up close (percept depends on absolute retinal sizes and thus, will vary depending on monitor size and resolution as well as viewing distance).
Goals:
EXPERIMENT 1:
Test whether the 16 arc minute tolerance for misalignment holds as true for the “pop-out” of paths as it does for contour interpolation.
EXPERIMENT 2:
Create a few different kinds of path detection elements, some of which are intended to eliminate the cues that are causing interpolations to be deleted in the second stage. Test whether these altered stimuli induce the perception of interpolated edges.
Method:
EXPERIMENT 1:
The “path detection” paradigm developed by Field, Hayes, and Hess (1993) was used to determine whether the 16 arc minute misalignment constraint on contour interpolation applies equally to the perceptual “pop-out” of paths. In this method, two stimuli are presented on each trial: one first, and then the second. Each stimulus contains a background of randomly oriented elements, but only one of the stimuli contains a target path. If this path “pops-out” at the observer, the observer should be able to detect it given a brief presentation of the stimulus. The task of the observer is to report, each trial, which of the two stimuli contained the hidden path.
Here, we are testing whether path detection will worsen with increasing misalignment, reaching chance performance around 16 arcminutes of misalignment. In addition, element type was also varied: the original “Gabor” elements were used, as were new elements that eliminated the surface differences between the element centers and their backgrounds. These new elements were expected to support the perception of interpolated contours.
EXPERIMENT 2:
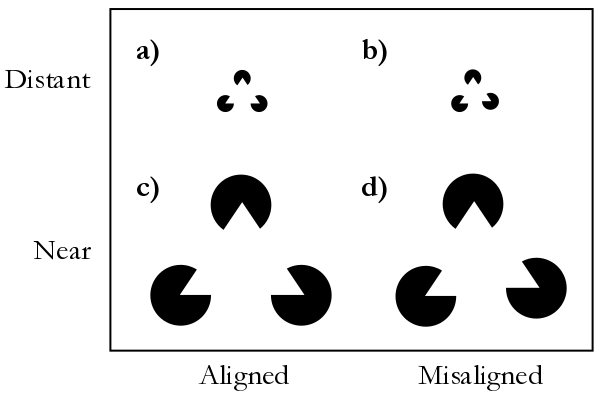
An experiment that measured subjective ratings of interpolated contour clarity was used to test whether interpolated edges are perceived for the modified elements with grey centers. Participants were presented with straight horizontal paths, like those shown in the figure below, while both element type and misalignment levels were varied. Participants were asked to rate, on a scale of 0 to 7, the extent to which they perceived clear interpolated contours connecting the path elements. Two of the element types used in the experiment are illustrated in the figure below.
Interpolated contours should be perceived only for the elements with grey centers. In addition, the ratings of interpolated contour clarity should decrease with increasing misalignment, in an identical fashion as the path detection performance, reaching chance at 16 arcminutes.

Example stimuli from Experiment 2. In a) and c), grey-centered and white-centered elements are perfectly aligned to a horizontal path. In b) and d), elements are misaligned. Both element type and misalignment (0, 4, 8, 12, 16, 20, 24, or 28 arcminutes) were varied across trials. Interpolated contours are expected to be perceived only for the grey-centered elements. In addition, for those elements, ratings of contour clarity should decrease with increasing misalignment, mirroring the decreases in path detection performance.
Results Summary
1) The Perceptual “pop-out” of paths is subject to the 16 arc minute misalignment constraint that is a constraint on contour interpolation
Path detection accuracy worsens with increasing levels of misalignment, reaching chance performance at ~16 arc minutes.
In addition, the pattern of performance decreasing is identical for both elements that do not give rise to the perception of interpolated contours as well as element types that do.
2) Subjective ratings of interpolated contour clarity reveal that participants perceive the altered element types to be connected by interpolated contours
Altered, but not traditional element types, were perceived to produce perceptions of interpolated contours.
Importantly, for the elements that did support the perception of interpolated contours, ratings of interpolated contour clarity decreased with increasing levels of misalignment, following a trajectory identical to that seen in experiment 1 for objective path detection importance.
3) The pattern of deterioration (in either path detection accuracy or interpolated contour clarity ratings) decreases with increasing misalignment in an identical fashion.
That is, path detection accuracy worsens at the same rate that ratings of interpolated contour clarity decrease.
The figure below shows illustrates a selection of data from both experiments superimposed.

Superimposed selection of data from both experiments. Path detection data are illustrated with solid lines while contour clarity ratings are illustrated with dashed lines. The y-axis for contour clarity ratings is given at right. Interpolated contours were perceived only for the grey-centered (and not the white-centered) elements: the contour clarity ratings for the white-centered Gabors are flat across the entire range of misalignments, while contour clarity ratings for grey-centered Gabors decrease with increasing misalignment, reaching a plateau at 16 arcminutes. This pattern of deterioration is highly similar to the deterioration observed for the path detection performance for both Gabor types.
Takeaways
These experiments:
1) Provide support for the two-stage theory of contour interpolation
2) Suggest that the contour integration evident in the path displays is really revealing the first stage of the contour interpolation process
3) Integrate two rich areas of literature that were previously not understood to rely on a common process
4) And, finally, demonstrate that intermediate outputs of visual processes can be subjected to empirical investigation